Forest Canopy Density (FCD)
The FCD product in specified forests are generated using the Forest Canopy Density Model (FCD algorithm), as applied by (Rikimaru, et al, 2002). TroFMIS approach made slight modification to the original FCD technique, by excluding Principal Component Analysis (PCA), which is computational intensive over large areas, or when computed using high resolution data. The modified FCD approach can be expressed as:
Where, the Advanced Vegetation Index (AVI), like many vegetation index, gives precedence to the areas with healthier vegetation as compraed to the areas with scarce or no vegetation. The AVI was computed as shown in the equation below.
The AVI was directly fused with Scaled Shadow Index (SSI), to yield the ultimate forest canopy densities. i.e. areas with canopy cover while segregating areas with very little or no vegetation. SSI applied the numerical intergration of Blue and Green bands to identify shadow covered areas as shown in the equation below.
The figure below summarizes the steps of generating FCD product using earth observation based methods.

Fig. 1 FCD computation summary.
Step 1. Example:
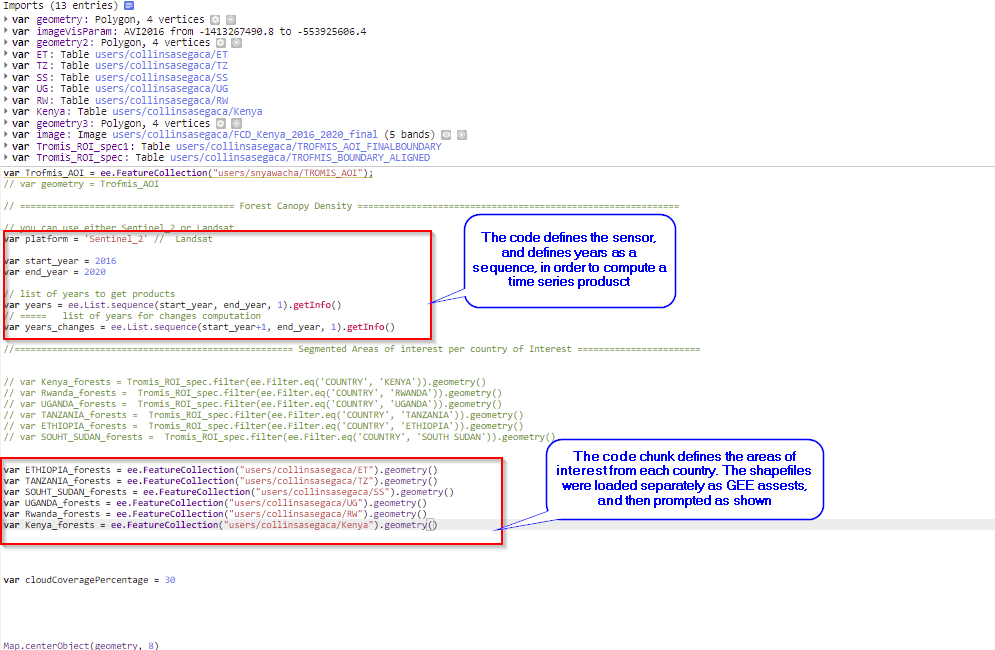
// var geometry = Trofmis_AOI // ======================================== Forest Canopy Density ============================================================ // you can use either Sentinel_2 or Landsat var platform = 'Sentinel_2' // Landsat var start_year = 2016 var end_year = 2020 // list of years to get products var years = ee.List.sequence(start_year, end_year, 1).getInfo() // ===== list of years for changes computation var years_changes = ee.List.sequence(start_year+1, end_year, 1).getInfo() //==================================================== Segmented Areas of interest per country of Interest ======================= // var Kenya_forests = Tromis_ROI_spec.filter(ee.Filter.eq('COUNTRY', 'KENYA')).geometry() // var Rwanda_forests = Tromis_ROI_spec.filter(ee.Filter.eq('COUNTRY', 'RWANDA')).geometry() // var UGANDA_forests = Tromis_ROI_spec.filter(ee.Filter.eq('COUNTRY', 'UGANDA')).geometry() // var TANZANIA_forests = Tromis_ROI_spec.filter(ee.Filter.eq('COUNTRY', 'TANZANIA')).geometry() // var ETHIOPIA_forests = Tromis_ROI_spec.filter(ee.Filter.eq('COUNTRY', 'ETHIOPIA')).geometry() // var SOUHT_SUDAN_forests = Tromis_ROI_spec.filter(ee.Filter.eq('COUNTRY', 'SOUTH SUDAN')).geometry() var ETHIOPIA_forests = ee.FeatureCollection("users/collinsasegaca/ET").geometry() var TANZANIA_forests = ee.FeatureCollection("users/collinsasegaca/TZ").geometry() var SOUHT_SUDAN_forests = ee.FeatureCollection("users/collinsasegaca/SS").geometry() var UGANDA_forests = ee.FeatureCollection("users/collinsasegaca/UG").geometry() var Rwanda_forests = ee.FeatureCollection("users/collinsasegaca/RW").geometry() var Kenya_forests = ee.FeatureCollection("users/collinsasegaca/Kenya").geometry() var cloudCoveragePercentage = 30 Map.centerObject(geometry, 8) // Functions ===================================================================================== // ==============================Normalization Function =============================================== function normalization_100(image,region,scale){ var mean_std = image.reduceRegion({ reducer: ee.Reducer.mean() .combine(ee.Reducer.stdDev(),null, true), geometry: region, scale: scale, maxPixels: 10e9, // tileScale: 16 }); // use unit scale to normalize the pixel values var unitScale = ee.ImageCollection.fromImages( image.bandNames().map(function(name){ name = ee.String(name); var band = image.select(name); var mean=ee.Number(mean_std.get(name.cat('_mean'))); var std=ee.Number(mean_std.get(name.cat('_stdDev'))); var max=mean.add(std.multiply(3)) var min=mean.subtract(std.multiply(3)) var band1=ee.Image(min).multiply(band.lt(min)).add(ee.Image(max).multiply(band.gt(max))) .add(band.multiply(ee.Image(1).subtract(band.lt(min)).subtract(band.gt(max)))) var result_band=band1.subtract(min).divide(max.subtract(min)); return result_band; })).toBands().rename(image.bandNames()); return unitScale .multiply(100) ; } // ====================== Advanced Vegetation index Function ============================= function AVI(Image,year,AOI,scale){ var avi = Image.expression('((nir + 1 )* (65536-red) *(nir -red))**0.333',{ 'nir':Image.select(['NIR']), 'red':Image.select(['RED']) } ).rename('AVI'+year) var AVI_norm = normalization_100(avi,AOI,scale) return AVI_norm } // ====================== Scaled Shaddow index Function ============================= function SSI(Image,year,AOI,scale){ var S_I = Image.expression('((65536-Green)*(65536-Blue)*(65536-Red))',{ 'Red':Image.select(['RED']), 'Green':Image.select(['Green']), //****** 'Blue':Image.select(['Blue']) } ).rename('SI'+year) var SSI = normalization_100(S_I,AOI,scale) return SSI } // ===================================== Forest canpoy density ============================== function FCD_calculation(AVI,SSI,year){ return AVI.expression( '((AVI*SSI+1)**0.5)-1', { 'AVI': AVI.select('AVI'+year), 'SSI': SSI.select('SI'+year) }).rename('FCD'+year); } // ==================================== Reclassification and change detection =================== function reclass_changes(Image,year){ // get four classes var FCD_4_classes = Image.multiply(0) .where(Image.eq(0).and(Image.lte(30)), 1) // non forest .where(Image.gt(30).and(Image.lte(45)), 2) // open .where(Image.gt(45).and(Image.lte(65)), 3) // moderate .where(Image.gt(65).and(Image.lte(100)), 4) // dense // get two classes var FCD_2_clases = FCD_4_classes.multiply(0) .where(FCD_4_classes.eq(1), 1) // non forest .where(FCD_4_classes.gte(2).and(FCD_4_classes.lte(4)), 2) // Forest // get the changes gains and losses function forestchange(year){ var prevyear = year -1 var current = FCD_2_clases.select("FCD"+year) var prev = FCD_2_clases.select("FCD"+prevyear) var change = current.subtract(prev); var classifified = (change.multiply(0) .where(change.eq(0),1) //No chnage .where(change.gt(0),2) // gain .where(change.lt(0),3)).rename('Changes'+year) //loss // print(classifified) return classifified } // get the changes gains and losses function forestchange_reference(year){ var prevyear = 2016 var current = FCD_2_clases.select("FCD"+year) var prev = FCD_2_clases.select("FCD"+prevyear) var change = current.subtract(prev); var classifified_ref = (change.multiply(0) .where(change.eq(0),1) //stable .where(change.gt(0),2) // gain .where(change.lt(0),3)).rename('Changes'+year) //loss // print(classifified) return classifified_ref } var ForestChange = ee.Image.cat(year.map(forestchange)) var ForestChange_ref = ee.Image.cat(year.map(forestchange_reference)) // print(ForestChange) return [FCD_4_classes, FCD_2_clases, ForestChange, ForestChange_ref] } // Function to compute the FCD and changes, takes in the year, change years and area of interest ==== function FCD_and_changes(year,AOI, change_years) { // Sentinel 2 image collection =========================== var collection_S2 = ee.ImageCollection('COPERNICUS/S2') // searches all sentinel 2 imagery pixels... .filter(ee.Filter.lt("CLOUDY_PIXEL_PERCENTAGE", 5)) // ...filters on the metadata for pixels less than 10% cloud // .filterDate('2016-01-01' ,'2021-05-31') //... chooses only pixels between the dates you define here .sort('CLOUDY_PIXEL_PERCENTAGE') .filterBounds(AOI) // // Cloud Masking function Sentinel 2 function maskS2clouds(image) { var qa = image.select('QA60'); // Bits 10 and 11 are clouds and cirrus, respectively. var cloudBitMask = Math.pow(2, 10); var cirrusBitMask = Math.pow(2, 11); // Both flags should be set to zero, indicating clear conditions. var mask = qa.bitwiseAnd(cloudBitMask).eq(0).and( qa.bitwiseAnd(cirrusBitMask).eq(0)); // Return the masked and scaled data. return image.updateMask(mask).divide(10000); } // ==================================================Landsat Images acqusition for FCD======================================================== //-------------------------------------------------------------------- // Landsat 4, 5, 7 cloudmask //-------------------------------------------------------------------- // If the cloud bit (5) is set and the cloud confidence (7) is high // or the cloud shadow bit is set (3), then it's a bad pixel. var cloudMaskL7 = function(image) { var qa = image.select('pixel_qa'); var cloud = qa.bitwiseAnd(1 << 5) .and(qa.bitwiseAnd(1 << 7)) .or(qa.bitwiseAnd(1 << 3)); // Remove edge pixels that don't occur in all bands //var mask2 = image.mask().reduce(ee.Reducer.min())//.focal_min(300,'square','meters').eq(0); //var mask2 = image.select('B4').reduce(ee.Reducer.min()).gt(0)//.focal_min(500,'square','meters'); // Remove edge pixels that don't occur in all bands var mask3 = (image.select('B3').gt(100)) .and(image.select('B4').gt(100)) .and(image.select('B4').lt(10000)) .and(image.select('B3').lt(10000)) return image.updateMask(cloud.not()).updateMask(mask3)//.updateMask(mask2)//.clip(image.geometry().buffer(-5000))//.or(mask3)); }; var cloudMaskL45 = function(image) { var qa = image.select('pixel_qa'); var cloud = qa.bitwiseAnd(1 << 5) .and(qa.bitwiseAnd(1 << 7)) .or(qa.bitwiseAnd(1 << 3)); // Remove edge pixels that don't occur in all bands //var mask2 = image.mask().reduce(ee.Reducer.min()); var mask2 = (image.select('B3').gt(100)) .and(image.select('B4').gt(100)) .and(image.select('B4').lt(10000)) .and(image.select('B3').lt(10000)) return (image.updateMask(cloud.not()).updateMask(mask2))//.clip(image.geometry().buffer(-5000))//.updateMask(mask2); }; //-------------------------------------------------------------------- // Landsat 8 cloudmask //-------------------------------------------------------------------- // Bits 3 and 5 are cloud shadow and cloud, respectively. function maskL8sr(image) { var cloudShadowBitMask = (1 << 3); var cloudsBitMask = (1 << 5); // Get the pixel QA band. var qa = image.select('pixel_qa'); // Both flags should be set to zero, indicating clear conditions. var mask = qa.bitwiseAnd(cloudShadowBitMask).eq(0) .and(qa.bitwiseAnd(cloudsBitMask).eq(0)); var mask2 = (image.select('B5').gt(100)) .and(image.select('B4').gt(100)) .and(image.select('B5').lt(10000)) .and(image.select('B4').lt(10000)) //var mask2 = image.mask().reduce(ee.Reducer.min()).focal_min(500,'square','meters'); //return image return image.updateMask(mask).updateMask(mask2)//.clip(image.geometry().buffer(-5000)); } var studyarea = AOI // Apply Cloudmask to L4.5.7 var L4 = ee.ImageCollection("LANDSAT/LT04/C01/T1_SR") // .filterDate(start_date, end_date) .filter(ee.Filter.lessThan('CLOUD_COVER_LAND', cloudCoveragePercentage)) .filterBounds(studyarea) .map(cloudMaskL45) .select(['B1','B2','B3', 'B4', 'B5'], ['Green','Blue','RED', 'NIR', 'SWIR1']); var L5 = ee.ImageCollection('LANDSAT/LT05/C01/T1_SR') // .filterDate(start_date, end_date) .filter(ee.Filter.lessThan('CLOUD_COVER_LAND', cloudCoveragePercentage)) .filterBounds(studyarea) .map(cloudMaskL45) .select(['B1','B2','B3', 'B4', 'B5'], ['Green','Blue','RED', 'NIR', 'SWIR1']); var L7a = ee.ImageCollection('LANDSAT/LE07/C01/T1_SR') //.filterDate('1999-01-01', '2003-04-01') // .filterDate(start_date, end_date) .filter(ee.Filter.lessThan('CLOUD_COVER_LAND', 100)) .filterBounds(studyarea) .map(cloudMaskL7) .select(['B1','B2','B3', 'B4', 'B5'], ['Green','Blue','RED', 'NIR', 'SWIR1']); var L7b = ee.ImageCollection('LANDSAT/LE07/C01/T1_SR') //.filterDate('2012-01-01', '2013-12-31') // .filterDate(start_date, end_date) .filter(ee.Filter.lessThan('CLOUD_COVER_LAND', 100)) .filterBounds(studyarea) .map(cloudMaskL7) .select(['B1','B2','B3', 'B4', 'B5'], ['Green','Blue','RED', 'NIR', 'SWIR1']); var L7 = L7a.merge(L7b) var L8 = ee.ImageCollection('LANDSAT/LC08/C01/T1_SR') // .filterDate(start_date, end_date) .filter(ee.Filter.lessThan('CLOUD_COVER', cloudCoveragePercentage)) .filterBounds(studyarea) //.filterBounds(AOI) .map(maskL8sr) .select(['B2','B3','B4', 'B5', 'B6'], ['Green','Blue','RED', 'NIR','SWIR1']); //Define collection //-------------------------------------------------------------------- // Merge Landsat 4, 5, 8 imagery collections and filter all by date/place //-------------------------------------------------------------------- //Merge Landsat 4, 5 , 7 ' var L458 = L4.merge(L5).merge(L8); // print(L458.filterDate('2000-01-12','2011-12-31')) var L4578 = L4.merge(L5).merge(L7).merge(L8); var L8754 = L8.merge(L7).merge(L5).merge(L4); function image_acquisition_processing(year){ // ===================== Change the image collection with selection of platform. if (platform == 'Sentinel_2'){ var scale = 10 var input_image = collection_S2.filterDate(year+'-01-01',year+'-12-31').map(maskS2clouds) .select(['B3','B2','B4','B8','B11'],['Green','Blue','RED', 'NIR','SWIR1']) .median().clip(AOI) }else if (platform == 'Landsat'){ var scale = 30 var input_image = L8754.filterDate(year+'-01-01',year+'-12-31').median().clip(AOI) } var AVI_out = AVI(input_image,year,AOI,scale) var SSI_out = SSI(input_image,year,AOI,scale) var FCD_product = FCD_calculation(AVI_out,SSI_out,year) return FCD_product } var fcd_output = ee.Image.cat(year.map(image_acquisition_processing)) // ==================================== integrate changes computation ============================================================================================== if (start_year < end_year){ var changes_output = reclass_changes(fcd_output,change_years) // gains and losses var computed_forest_changes = changes_output[2] //.mask(changes_output[2].gte(2)) var changes_reference = changes_output[3] var products = [fcd_output, computed_forest_changes, changes_reference] } else if (start_year == end_year){ print('you cannot compute changes in a single year') var changes_output = [] // gains and losses var computed_forest_changes = [] var products = [fcd_output] } // get the outputs return products } // first item in the list = FCD //second item in the list = Anual changes // third item in the list = changes from the reference year 2016 var Kenya_fcd = FCD_and_changes(years,Kenya_forests,years_changes) var Tanzania_fcd = FCD_and_changes(years,TANZANIA_forests,years_changes) var UGANDA_fcd = FCD_and_changes(years,UGANDA_forests,years_changes) var Ethiopia_fcd = FCD_and_changes(years,ETHIOPIA_forests,years_changes) var S_sudan_fcd = FCD_and_changes(years,SOUHT_SUDAN_forests,years_changes) var Rwanda_fcd = FCD_and_changes(years,Rwanda_forests,years_changes) // print(Kenya_fcd[1]) // value 2 gain and 3 loss Map.addLayer(Tanzania_fcd[0].select("FCD2017"), {min:0, max:70, palette:['red','green', 'blue']}, 'fcd_Tanzania') Map.addLayer(UGANDA_fcd[2].select("Changes2018"), {min:1, max:3, palette:['green','blue', 'red']}, 'changes2018') // change scale with image selection if (platform == 'Sentinel_2'){ var scale = 10 }else if (platform == 'Landsat'){ var scale = 30 } function msk_out(image){ var updated = image.updateMask(image.gt(0)) return updated } // Kenya exports Export.image.toDrive({ image: msk_out(Kenya_fcd[0]), description: 'FCD_Kenya_'+start_year+'_'+end_year+'_'+platform, fileNamePrefix: 'FCD_Kenya_'+start_year+'_'+end_year+'_'+platform, region: Kenya_forests, scale: scale, maxPixels: 1e13, folder:'TROFMIS_products/'+platform+'/FCD' }); Export.image.toDrive({ image: msk_out(Kenya_fcd[1]), description: 'Changes_Kenya_'+start_year+'_'+end_year+'_'+platform, fileNamePrefix: 'Changes_Kenya_'+start_year+'_'+end_year+'_'+platform, region: Kenya_forests, scale: scale, maxPixels: 1e13, folder:'TROFMIS_products/'+platform+'/Changes_and_reference' }); Export.image.toDrive({ image: msk_out(Kenya_fcd[2]), description: 'Changes_Kenya_ref_'+start_year+'_'+end_year+'_'+platform, fileNamePrefix: 'Changes_Kenya_ref'+start_year+'_'+end_year+'_'+platform, region: Kenya_forests, scale: scale, maxPixels: 1e13, folder:'TROFMIS_products/'+platform+'/Changes_and_reference' }); // Tanzania Export Export.image.toDrive({ image: msk_out(Tanzania_fcd[0]), description: 'FCD_Tanzania_'+start_year+'_'+end_year+'_'+platform, fileNamePrefix: 'FCD_Tanzania_'+start_year+'_'+end_year+'_'+platform, region: TANZANIA_forests, scale: scale, maxPixels: 1e13, folder:'TROFMIS_products/'+platform+'/FCD' }); Export.image.toDrive({ image: msk_out(Tanzania_fcd[1]), description: 'Changes_Tanzania_'+start_year+'_'+end_year+'_'+platform, fileNamePrefix: 'Changes_Tanzania_'+start_year+'_'+end_year+'_'+platform, region: TANZANIA_forests, scale: scale, maxPixels: 1e13, folder:'TROFMIS_products/'+platform+'/Changes_and_reference' }); Export.image.toDrive({ image: msk_out(Tanzania_fcd[2]), description: 'Changes_Tanzania_ref_'+start_year+'_'+end_year+'_'+platform, fileNamePrefix: 'Changes_Tanzania_ref'+start_year+'_'+end_year+'_'+platform, region: TANZANIA_forests, scale: scale, maxPixels: 1e13, folder:'TROFMIS_products/'+platform+'/Changes_and_reference' }); // Uganda Export Export.image.toDrive({ image: UGANDA_fcd[0].updateMask(UGANDA_fcd[0].gt(0)), description: 'FCD_UGANDA_'+start_year+'_'+end_year+'_'+platform, fileNamePrefix: 'FCD_UGANDA_'+start_year+'_'+end_year+'_'+platform, region: UGANDA_forests, scale: scale, maxPixels: 1e13, folder:'TROFMIS_products/'+platform+'/FCD' }); Export.image.toDrive({ image: UGANDA_fcd[1].updateMask(UGANDA_fcd[1].gt(0)), description: 'Changes_UGANDA_'+start_year+'_'+end_year+'_'+platform, fileNamePrefix: 'Changes_UGANDA_'+start_year+'_'+end_year+'_'+platform, region: UGANDA_forests, scale: scale, maxPixels: 1e13, folder:'TROFMIS_products/'+platform+'/Changes_and_reference' }); Export.image.toDrive({ image: UGANDA_fcd[2].updateMask(UGANDA_fcd[2].gt(0)), description: 'Changes_UGANDA_ref_'+start_year+'_'+end_year+'_'+platform, fileNamePrefix: 'Changes_UGANDA_ref'+start_year+'_'+end_year+'_'+platform, region: UGANDA_forests, scale: scale, maxPixels: 1e13, folder:'TROFMIS_products/'+platform+'/Changes_and_reference' }); // Rwanda export Export.image.toDrive({ image: Rwanda_fcd[0].updateMask(Rwanda_fcd[0].gt(0)), description: 'FCD_RWANDA_'+start_year+'_'+end_year+'_'+platform, fileNamePrefix: 'FCD_RWANDA_'+start_year+'_'+end_year+'_'+platform, region: Rwanda_forests, scale: scale, maxPixels: 1e13, folder:'TROFMIS_products/'+platform+'/FCD' }); Export.image.toDrive({ image: Rwanda_fcd[1].updateMask(Rwanda_fcd[1].gt(0)), description: 'Changes_RWANDA_'+start_year+'_'+end_year+'_'+platform, fileNamePrefix: 'Changes_RWANDA_'+start_year+'_'+end_year+'_'+platform, region: Rwanda_forests, scale: scale, maxPixels: 1e13, folder:'TROFMIS_products/'+platform+'/Changes_and_reference' }); Export.image.toDrive({ image: Rwanda_fcd[2].updateMask(Rwanda_fcd[2].gt(0)), description: 'Changes_RWANDA_ref_'+start_year+'_'+end_year+'_'+platform, fileNamePrefix: 'Changes_RWANDA_ref'+start_year+'_'+end_year+'_'+platform, region: Rwanda_forests, scale: scale, maxPixels: 1e13, folder:'TROFMIS_products/'+platform+'/Changes_and_reference' }); // South Sudan Export.image.toDrive({ image: S_sudan_fcd[0].updateMask(S_sudan_fcd[0].gt(0)), description: 'FCD_S_SUDAN_'+start_year+'_'+end_year+'_'+platform, fileNamePrefix: 'FCD_S_SUDAN_'+start_year+'_'+end_year+'_'+platform, region: SOUHT_SUDAN_forests, scale: scale, maxPixels: 1e13, folder:'TROFMIS_products/'+platform+'/FCD' }); Export.image.toDrive({ image: S_sudan_fcd[1].updateMask(S_sudan_fcd[1].gt(0)), description: 'Changes_S_SUDAN_'+start_year+'_'+end_year+'_'+platform, fileNamePrefix: 'Changes_S_SUDAN_'+start_year+'_'+end_year+'_'+platform, region: SOUHT_SUDAN_forests, scale: scale, maxPixels: 1e13, folder:'TROFMIS_products/'+platform+'/Changes_and_reference' }); Export.image.toDrive({ image: S_sudan_fcd[2].updateMask(S_sudan_fcd[2].gt(0)), description: 'Changes_S_SUDAN_ref_'+start_year+'_'+end_year+'_'+platform, fileNamePrefix: 'Changes_S_SUDAN_ref'+start_year+'_'+end_year+'_'+platform, region: SOUHT_SUDAN_forests, scale: scale, maxPixels: 1e13, folder:'TROFMIS_products/'+platform+'/Changes_and_reference' }); // Ethiopia Exports Export.image.toDrive({ image: Ethiopia_fcd[0].updateMask(Ethiopia_fcd[0].gt(0)), description: 'FCD_ETHIOPIA_'+start_year+'_'+end_year+'_'+platform, fileNamePrefix: 'FCD_ETHIOPIA_'+start_year+'_'+end_year+'_'+platform, region: ETHIOPIA_forests, scale: scale, maxPixels: 1e13, folder:'TROFMIS_products/'+platform+'/FCD' }); Export.image.toDrive({ image: Ethiopia_fcd[1].updateMask(Ethiopia_fcd[1].gt(0)), description: 'Changes_ETHIOPIA_'+start_year+'_'+end_year+'_'+platform, fileNamePrefix: 'Changes_ETHIOPIA_'+start_year+'_'+end_year+'_'+platform, region: ETHIOPIA_forests, scale: scale, maxPixels: 1e13, folder:'TROFMIS_products/'+platform+'/Changes_and_reference' }); Export.image.toDrive({ image: Ethiopia_fcd[2].updateMask(Ethiopia_fcd[2].gt(0)), description: 'Changes_ETHIOPIA_ref_'+start_year+'_'+end_year+'_'+platform, fileNamePrefix: 'Changes_ETHIOPIA_ref'+start_year+'_'+end_year+'_'+platform, region: ETHIOPIA_forests, scale: scale, maxPixels: 1e13, folder:'TROFMIS_products/'+platform+'/Changes_and_reference' });
Understanding the Code Chunk Above
Please see the description of the code in the blue call outs as shown below.
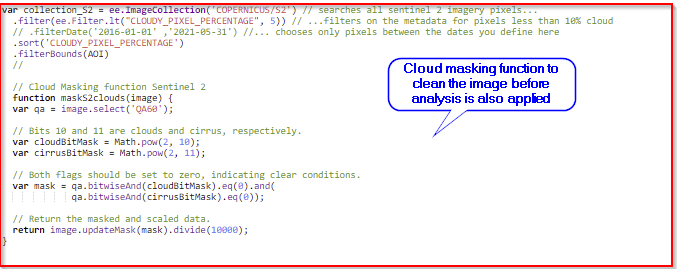
The acquired image is also taken through cloud masking function as is shown in the code chunk below.
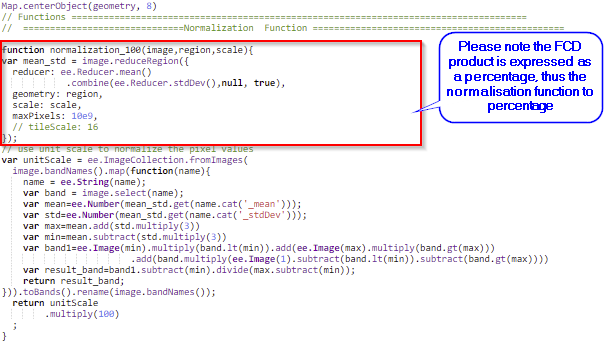
The FCD is expressed as a percentage, and the code chunk below is used to normalise the code into percentage.
The computatation expression are illustrated below.

The generated FCD products are then exported to google drive account for retrieval of the datasets from the drive. To avoid the complexities around downloading the huge tiff files from the drive, it is advisable to mount the google drive on the computer, in order to access the files normally, without necessarily downloading the products. See the code below.

To circumvent the problem of handling broken geo tiff files, we reccomend that the downloaded files be mosaicked together, before uploading them into the database, as will be dicussed in the next section. While applying different mosaicking codes, the codes that worked seamlessly were R scripts, however, python scripts are also available. See the code chunk below from R.
R code example to mosaic the files
setwd("G:/My Drive/TROFMIS_products IGADLandsat FCD")
getwd()

list.dirs("G:/My Drive/TROFMIS_products IGADLandsat FCD")

my_dirs<- "G:/My Drive/TROFMIS_products IGADLandsat FCD"

list.files()

all_text_files <- list.files(my_dirs, pattern = "\\.tif$", full.names = TRUE)
list_data <- list()

for (file in all_text_files){

  print(file)
}

cat(list1)
print(list1)

r1<-stack(all_text_files[1])
r2<-stack(all_text_files[2])
r3<-stack(all_text_files[3])
r4<-stack(all_text_files[4])
r5<-stack(all_text_files[5])
r6<-stack(all_text_files[6])
r7<-stack(all_text_files[7])
r8<-stack(all_text_files[8])
r9<-stack(all_text_files[9])
r10<-stack(all_text_files[10])
r11<-stack(all_text_files[11])
r12<-stack(all_text_files[12])
r13<-stack(all_text_files[13])
r14<-stack(all_text_files[14])
r15<-stack(all_text_files[15])
r16<-stack(all_text_files[16])
r17<-stack(all_text_files[17])
r18<-stack(all_text_files[18])
r19<-stack(all_text_files[19])
r20<-stack(all_text_files[20])
r21<-stack(all_text_files[21])
r22<-stack(all_text_files[22])
r23<-stack(all_text_files[23])
r24<-stack(all_text_files[24])
r25<-stack(all_text_files[25])
r26<-stack(all_text_files[26])
r27<-stack(all_text_files[27])
r28<-stack(all_text_files[28])
r29<-stack(all_text_files[29])
r30<-stack(all_text_files[30])
r31<-stack(all_text_files[31])
r32<-stack(all_text_files[32])
r33<-stack(all_text_files[33])
r34<-stack(all_text_files[34])
r35<-stack(all_text_files[35])
r36<-stack(all_text_files[36])
r37<-stack(all_text_files[37])
r38<-stack(all_text_files[38])
r39<-stack(all_text_files[39])
r40<-stack(all_text_files[40])
r41<-stack(all_text_files[41])
r42<-stack(all_text_files[42])
r43<-stack(all_text_files[43])
r44<-stack(all_text_files[44])
r45<-stack(all_text_files[45])
r46<-stack(all_text_files[46])
r47<-stack(all_text_files[47])
r48<-stack(all_text_files[48])
r49<-stack(all_text_files[49])
r50<-stack(all_text_files[50])
r51<-stack(all_text_files[51])
r52<-stack(all_text_files[52])
r53<-stack(all_text_files[53])
r54<-stack(all_text_files[54])
r55<-stack(all_text_files[55])
r56<-stack(all_text_files[56])
r57<-stack(all_text_files[57])
r58<-stack(all_text_files[58])
r59<-stack(all_text_files[59])
r60<-stack(all_text_files[60])

print(r19)

rmoz<- mosaic(r1,r2,r3,r4,r5,r6,r7,r8,r9,r10,r11,r12,r13,r14,r15,r16,r17,r18,
              r19,r20,r21,r22,r23,r24,r25,r26,r27,r28,r29,r30,r31,r32,r33,r34,r35,
              r36,r37,r38,r39,r40,r41,r42,r43,r44,r45,r46,r47,r48,r49,r50,r51,r52,
              r53,r54,r55,r56,r57,r58,r59,r60
              ,fun = mean,filename = 'FCD_OUTPUT_2019.tif', tolerance=0.05)
rmoz
plot(r3)
When the rasters are a multiband raster, the call function stack is used, else, R normally calls single rasters as raster
FCD Data Encoding
The FCD product is rescaled to percentage, using a linear regression model. The values are later reclassified into various Forest Canopy classes. The percentage output values of this equation geovisualises areas of Dense Canopy, Moderate Canopy and Open Canopy between 100 to 65, 65 to 45, 45 to 30 respectively, while the Non- Forest areas were capped at below 30 percent as captured in the table below.
Sensor/Dataset |
Min |
Max |
|---|---|---|
Non Forest |
0 |
30 |
Open Canopy |
30 |
45 |
Moderate Canopy |
45 |
65 |
Dense Canopy |
65 |
100 |
The Style Descriptor Layer for use in visualising FCD is as shwon in the code chunck below.
<?xml version="1.0" encoding="UTF-8"?>
<StyledLayerDescriptor xmlns="http://www.opengis.net/sld" version="1.0.0"
xmlns:sld="http://www.opengis.net/sld" xmlns:gml="http://www.opengis.net/gml"         xmlns:ogc="http://www.opengis.net/ogc">
  <UserLayer>
    <sld:LayerFeatureConstraints>
      <sld:FeatureTypeConstraint/>
    </sld:LayerFeatureConstraints>
    <sld:UserStyle>
      <sld:Name>FCD2001_mos</sld:Name>
      <sld:FeatureTypeStyle>
        <sld:Rule>
          <sld:RasterSymbolizer>
            <sld:ChannelSelection>
              <sld:GrayChannel>
                <sld:SourceChannelName>1</sld:SourceChannelName>
              </sld:GrayChannel>
            </sld:ChannelSelection>
            <sld:ColorMap type="intervals">
              <sld:ColorMapEntry label="Non Forest" quantity="30" color="#f4f1da"/>
              <sld:ColorMapEntry label="Moderate Dense" quantity="45" color="#a8a800"/>
              <sld:ColorMapEntry label="Open Forest" quantity="65" color="#00d238"/>
              <sld:ColorMapEntry label="Dense Forest" quantity="100" color="#267300"/>
            </sld:ColorMap>
          </sld:RasterSymbolizer>
        </sld:Rule>
      </sld:FeatureTypeStyle>
    </sld:UserStyle>
  </UserLayer>
</StyledLayerDescriptor>
To compute the FCD output, the figure below summarises the steps applied in the computation.